.png)
In modern sales operations, relying solely on quota achievement limits insight into what drives revenue growth. To build a scalable and predictable sales engine, you need a broader set of indicators that track efficiency, quality, and velocity.
These sales performance metrics examples provide a 360-degree view of your sales process. You’ll discover where bottlenecks occur, which tactics yield the highest ROI, and how to forecast revenue with greater accuracy. Tracking these metrics helps sales leaders align strategy with execution and empowers reps to prioritize high-impact activities. When you monitor the right data points, every decision becomes a calculated move toward growth.
"Metrics turn sales from guesswork into predictable science"
For each example, we break down the definition, calculation formula, and real-world use case. You’ll also get tactical insights, deep strategic analysis, and actionable takeaways. By the end, you’ll know exactly which numbers to track, how to interpret them, and how to apply those insights to optimize lead qualification, shorten your sales cycle, and boost revenue predictability.
Sales revenue is the quintessential sales performance metric, representing the total income generated from selling goods or services before any costs are deducted. It's the top-line figure on an income statement and provides the most direct measure of the sales team's effectiveness in generating business. Calculated simply by multiplying the number of units sold by the average price per unit, this metric is the bedrock of financial analysis and strategic planning.

As one of the most fundamental sales performance metrics examples, it serves as the primary indicator of market demand, business growth, and overall commercial health. While other metrics offer nuanced insights into efficiency and profitability, sales revenue provides a clear, high-level snapshot of performance.
While straightforward, analyzing sales revenue with strategic depth unlocks powerful insights. Companies like Microsoft don't just look at their total revenue; they segment it by division (e.g., Azure, Office, Gaming) to understand which products are driving growth. This allows them to allocate resources, double down on successful strategies, and identify underperforming areas that need attention.
Strategic Insight: Segmenting revenue reveals the "who, what, and where" behind your sales. It moves the conversation from "how much did we make?" to "where is our most valuable revenue coming from?"
Consider Amazon, which monitors revenue per product category. This data directly informs inventory management, marketing spend, and even the user experience on its website. If a specific category shows surging revenue, Amazon can proactively increase stock and feature those products more prominently to capitalize on the trend.
To effectively use sales revenue as a performance metric, move beyond the top-line number.
Conversion rate is a critical metric that measures the percentage of prospects who complete a desired action, moving from one stage of the sales funnel to the next. It’s calculated by dividing the number of conversions by the total number of leads or opportunities, then multiplying by 100. This metric is essential for identifying bottlenecks in the sales process and evaluating the effectiveness of sales and marketing tactics at each stage.
As one of the most insightful sales performance metrics examples, it diagnoses the health of your sales process. While revenue tells you the outcome, conversion rate reveals the efficiency of the journey, showing where prospects drop off and where your team excels.
High-growth companies use conversion rate analysis to pinpoint weaknesses and optimize their entire customer acquisition funnel. For instance, HubSpot tracks conversion rates from website visitor to lead and from lead to marketing qualified lead (MQL). By analyzing this data, they can determine if a low conversion rate is due to poor landing page copy, a confusing user experience, or ineffective lead-nurturing campaigns.
Strategic Insight: Conversion rates are the vital signs of your sales funnel. A low rate at a specific stage is a clear signal of a problem that needs immediate diagnosis and treatment, preventing revenue loss down the line.
Similarly, Shopify merchants obsessively monitor their cart-to-purchase conversion rates. A small improvement here, such as simplifying the checkout process or adding more payment options, can lead to a significant increase in revenue. This focus on stage-specific conversion allows for targeted, high-impact improvements rather than broad, ineffective changes.
This infographic provides a quick reference for common B2B conversion rate benchmarks across the sales funnel.
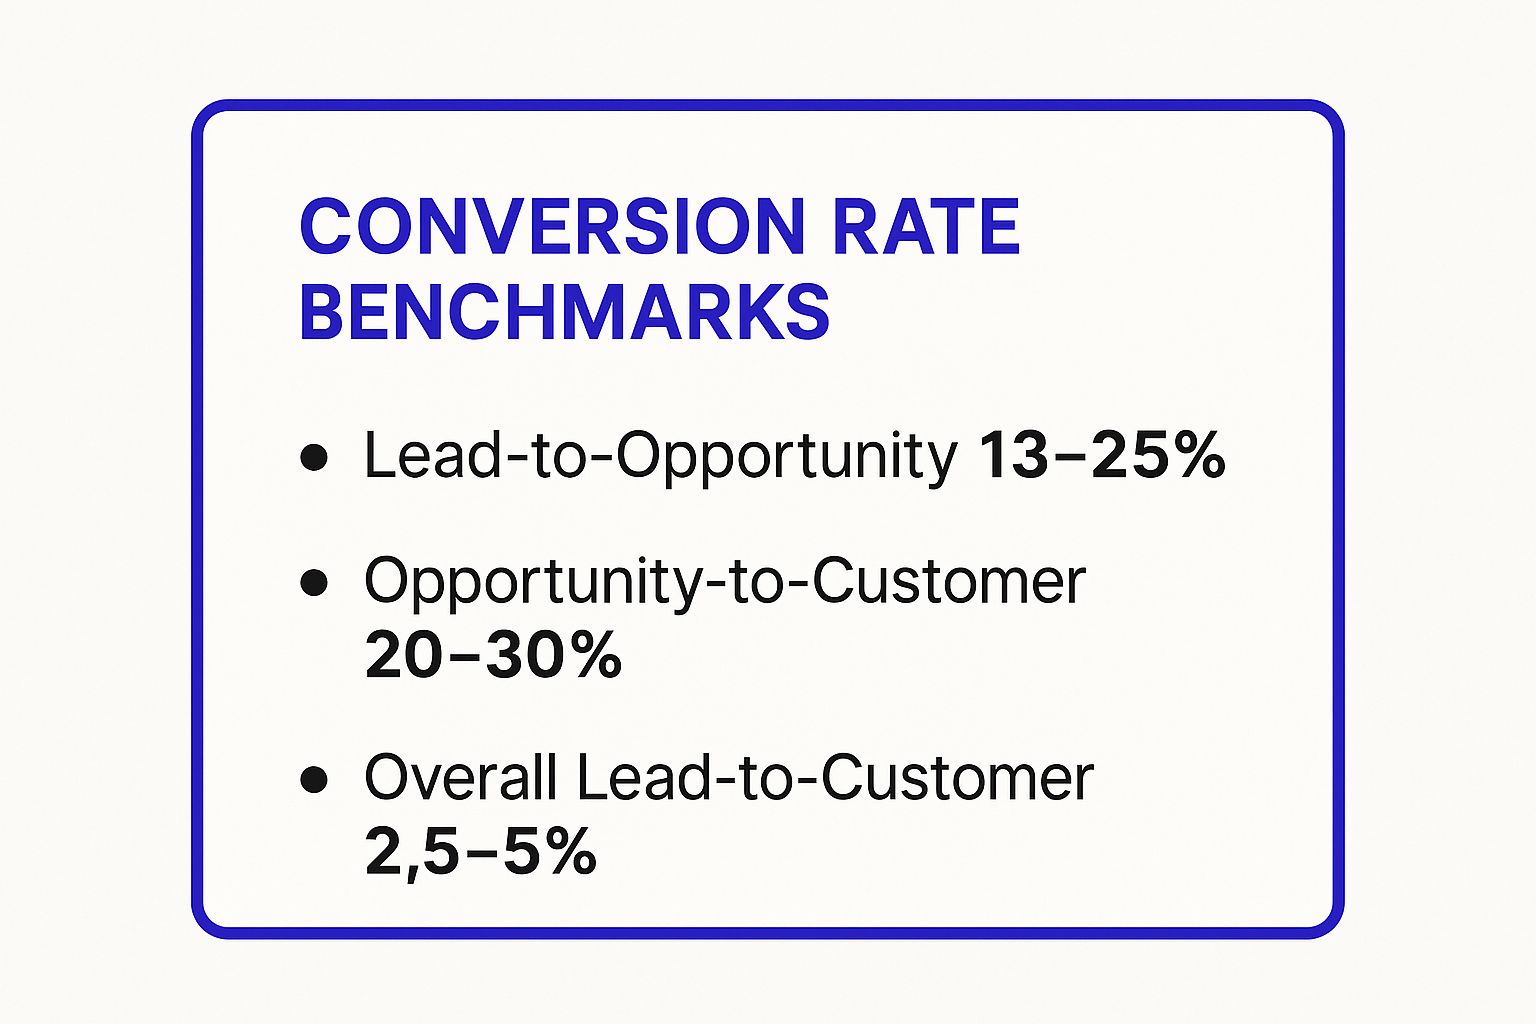
These benchmarks highlight the significant drop-off that occurs at each stage, reinforcing the need to optimize every step of the process.
To leverage conversion rates for performance improvement, you need a granular approach.
Average deal size, also known as average contract value (ACV), measures the typical monetary value of a closed deal over a specific period. It is calculated by dividing the total revenue generated from new deals by the number of deals closed. This metric is crucial for understanding your ideal customer profile, forecasting revenue, and allocating sales resources effectively.

As one of the most insightful sales performance metrics examples, it reveals the health of your sales pipeline and the effectiveness of your sales strategy. A rising average deal size often indicates a move upmarket or successful upselling and cross-selling efforts, while a declining one might signal a shift toward smaller customers or increased discounting.
Simply tracking the average isn't enough; the real value comes from strategic segmentation. Salesforce, for instance, didn't just grow its customer base; it strategically increased its ACV by over 40% in key periods by focusing on enterprise clients. They achieved this by bundling multiple products (e.g., Sales Cloud, Service Cloud, Marketing Cloud) into comprehensive solutions that solve larger, more complex business problems for bigger companies.
Strategic Insight: A higher average deal size is not just about selling more; it's about selling smarter. It reflects your ability to communicate greater value, solve bigger problems, and align your product with high-value customer segments.
Similarly, Slack meticulously tracks ACV growth as a primary indicator of its penetration into the enterprise market. As more large corporations adopt Slack company-wide, its ACV climbs, signaling a successful transition from a popular team tool to an indispensable enterprise platform. This data directly informs their product roadmap and enterprise sales-team expansion.
To effectively leverage average deal size, you must dig deeper into the numbers.
Sales cycle length measures the average time it takes to close a deal, from the initial point of contact to the final signature. This metric, typically measured in days, is a critical indicator of sales process efficiency and forecasting accuracy. A shorter cycle can mean faster revenue recognition and a more efficient sales team, while a longer cycle might indicate process bottlenecks or complex buyer journeys.
As one of the most insightful sales performance metrics examples, it directly impacts resource allocation and pipeline health. By understanding how long deals take to close, sales leaders can more accurately predict when revenue will land, identify where deals are stalling, and coach reps on how to maintain momentum.
Simply knowing the average cycle length isn't enough; the real value comes from segmentation and analysis. For instance, SAP meticulously tracks the sales cycle length for deals closed through its direct sales force versus those closed via partner channels. This allows them to see which channel is more efficient for specific product lines or market segments, informing their channel strategy and investment.
Strategic Insight: Analyzing the stages within your sales cycle reveals process friction. It shifts the focus from "how long does it take?" to "where are we losing the most time?"
Consider Atlassian, a leader in product-led growth. They dramatically shortened their sales cycle by allowing products like Jira and Trello to essentially sell themselves. By enabling users to experience value through a free or low-cost tier, they bypass many traditional, time-consuming sales stages. This data helps them refine the product features that accelerate user adoption and conversion, creating a highly efficient sales model.
To use sales cycle length to optimize performance, you must dissect the data and act on it.
Customer Acquisition Cost (CAC) measures the total expense required to win a new customer. It encompasses all sales and marketing costs, from ad spend and content creation to sales commissions and salaries, divided by the number of new customers acquired in a specific period. This metric is a crucial gauge of the efficiency and sustainability of a company's growth engine, revealing whether its customer acquisition strategy is financially viable.

As one of the most critical sales performance metrics examples, particularly for subscription-based businesses, CAC provides a direct line of sight into the profitability of growth. A high CAC isn't inherently bad, but it must be justified by a correspondingly high customer lifetime value (LTV). Understanding this balance is the key to scalable success.
While the overall CAC is a vital health indicator, its true power lies in segmentation. SaaS leader HubSpot doesn't just look at its blended CAC; it analyzes it by channel (e.g., paid search, organic content, social media). This allows the company to double down on high-ROI channels and optimize or eliminate underperforming ones, ensuring every marketing dollar is spent effectively.
Strategic Insight: Your CAC isn't a single number; it's a collection of costs from different channels. Analyzing it by source reveals which acquisition engines are efficient and which are draining resources.
Consider Dropbox's legendary growth. Instead of pouring money into expensive paid advertising, the company engineered a dual-sided referral program that rewarded both the referrer and the new user with extra storage space. This viral loop dramatically lowered their CAC, allowing them to scale rapidly and efficiently by turning their user base into their most effective sales and marketing channel.
To use CAC to drive sustainable growth, you must go beyond a simple calculation.
Win rate is a critical diagnostic metric that measures the percentage of qualified opportunities or proposals that result in a closed-won deal. It is calculated by dividing the number of won deals by the total number of opportunities (won plus lost) and provides a clear barometer of sales effectiveness. This metric goes beyond revenue to reflect the quality of execution, competitive strength, and product-market fit.
As one of the most revealing sales performance metrics examples, win rate directly indicates how well a sales team converts qualified interest into actual business. A low win rate can signal issues with the sales process, pricing, product gaps, or competitive pressure, making it a pivotal metric for strategic adjustments.
Simply knowing your win rate is not enough; the real value comes from dissecting the "why" behind your wins and losses. Salesforce, for example, conducts rigorous win/loss analysis to refine its competitive battlecards and sales messaging. By understanding precisely why they lose to a specific competitor, they can equip their reps with more effective counter-arguments and positioning strategies for future encounters.
Strategic Insight: Your win rate tells you the outcome, but win/loss analysis tells you the story. This narrative is essential for improving your sales playbook, product roadmap, and competitive strategy.
Similarly, Microsoft tracks win rates for its different Azure service offerings. If a new cloud service has a significantly higher win rate than an older one, it informs their product development priorities and marketing focus. This data-driven approach ensures resources are allocated to the solutions most likely to succeed in the market.
To leverage win rate as a tool for continuous improvement, you must analyze it with granularity.
Sales pipeline coverage measures the ratio of the total value of qualified opportunities in your pipeline to your sales quota for a specific period. Calculated by dividing the total pipeline value by the quota, this forward-looking metric is crucial for determining if your sales team has enough potential deals to realistically meet its targets. It essentially answers the question: "Is our pipeline healthy enough to hit our number?"
As one of the most predictive sales performance metrics examples, pipeline coverage is essential for revenue forecasting and proactive sales management. It shifts the focus from reactive, end-of-quarter scrambling to a strategic, data-driven approach to building and maintaining a sufficient flow of opportunities throughout the entire sales period.
A one-size-fits-all coverage ratio doesn't exist; it must be tailored to your business model. For instance, Salesforce often advises its clients to aim for a 3x to 5x pipeline coverage, meaning for every $1 of quota, there should be $3 to $5 in the qualified pipeline. This accounts for deals that will be lost or pushed to the next quarter.
Strategic Insight: Pipeline coverage isn't just about quantity; it's a direct reflection of your sales cycle length and win rate. A higher ratio is needed to offset lower win rates or longer, more complex sales processes.
Enterprise software companies with 9-12 month sales cycles might require a 4x to 6x coverage to feel secure. In contrast, a high-velocity SaaS company like Zoom, with shorter cycles and higher win rates, might maintain a leaner 2x to 3x coverage. Companies like Outreach.io use this metric at the individual rep level to identify who needs more support in prospecting and pipeline generation, allowing for targeted coaching.
To effectively leverage sales pipeline coverage, go beyond a single, company-wide number.
Monthly Recurring Revenue (MRR) is the lifeblood of subscription-based businesses, measuring the predictable revenue stream generated each month. It normalizes contracts of varying lengths into a consistent monthly value, offering a clear picture of financial momentum. Calculated by multiplying the total number of paying customers by the average monthly revenue per customer, MRR is a foundational metric for forecasting, planning, and valuation in the SaaS world.
As one of the most critical sales performance metrics examples for any recurring revenue model, MRR and its growth rate provide an immediate health check. These figures show not just how much money is coming in, but also the velocity and direction of the business, making them indispensable for tracking scalability and market traction.
SaaS giants live and breathe by MRR. Salesforce, for example, reports its "subscription and support revenues" (an equivalent of Annual Recurring Revenue, or ARR) as a primary indicator of its business health. This focus allows them to demonstrate long-term customer value and predictable growth to investors. Similarly, during its IPO, Slack showcased its powerful business model by highlighting a Net Dollar Retention rate well over 100%, a feat achieved by generating more expansion MRR from existing customers than it lost to churn.
Strategic Insight: Deconstructing MRR into its core components (new, expansion, contraction, churn) transforms it from a simple revenue number into a diagnostic tool. It reveals precisely where growth is coming from and where value is leaking.
This granular analysis allows companies to take targeted action. For instance, if New MRR is high but Net MRR Churn is also high, it signals a "leaky bucket" problem. This might indicate an issue with product-market fit or a disconnect between sales promises and product reality, prompting leaders to invest in customer success and product improvements rather than just acquiring new logos.
To leverage MRR effectively, you must analyze its underlying dynamics.
As you’ve seen, tracking the right sales performance metrics examples is only the starting point. From core indicators like Sales Revenue and Conversion Rate to forward-looking signals like Pipeline Coverage and MRR Growth Rate, each metric offers a window into your team’s strengths and blind spots. Now it’s time to turn raw data into strategic moves that drive real growth.
“Metrics without action are just numbers on a screen. Turn insights into deals by applying tactical adjustments in real time.”
Each of these metrics isn’t just a measure—it’s a strategic lever. Use them to diagnose issues, test hypotheses, and iterate on your sales process continuously.
Select Your Core Metrics
Build a Shared Dashboard
Schedule Regular Reviews
Test and Iterate
By embedding these practices into your daily rhythm, you transform data from retrospective reports into proactive playbooks. You’ll not only see predictable revenue growth but also empower your team to spot opportunities before they become urgent problems.
With every metric you optimize, you’re building a stronger revenue engine that can weather market shifts and capitalize on emerging opportunities. The journey from data to deals starts with deliberate action steps—now it’s your turn to execute.
Ready to transform your metrics into meaningful conversations that drive revenue? Start using Upcraft to automate follow-ups, qualify leads with AI-driven insights, and integrate your sales performance metrics examples into a seamless workflow. Try Upcraft today and watch your data turn into deals.
Enter your contact information and Archer will start a conversation with you via text message.